
Designed for municipalities
One significant problem of municipality management is a wide pallete of devices, data sources, applications and web portals where information is distributed.
Ability to use this information is timely and costly dependent.
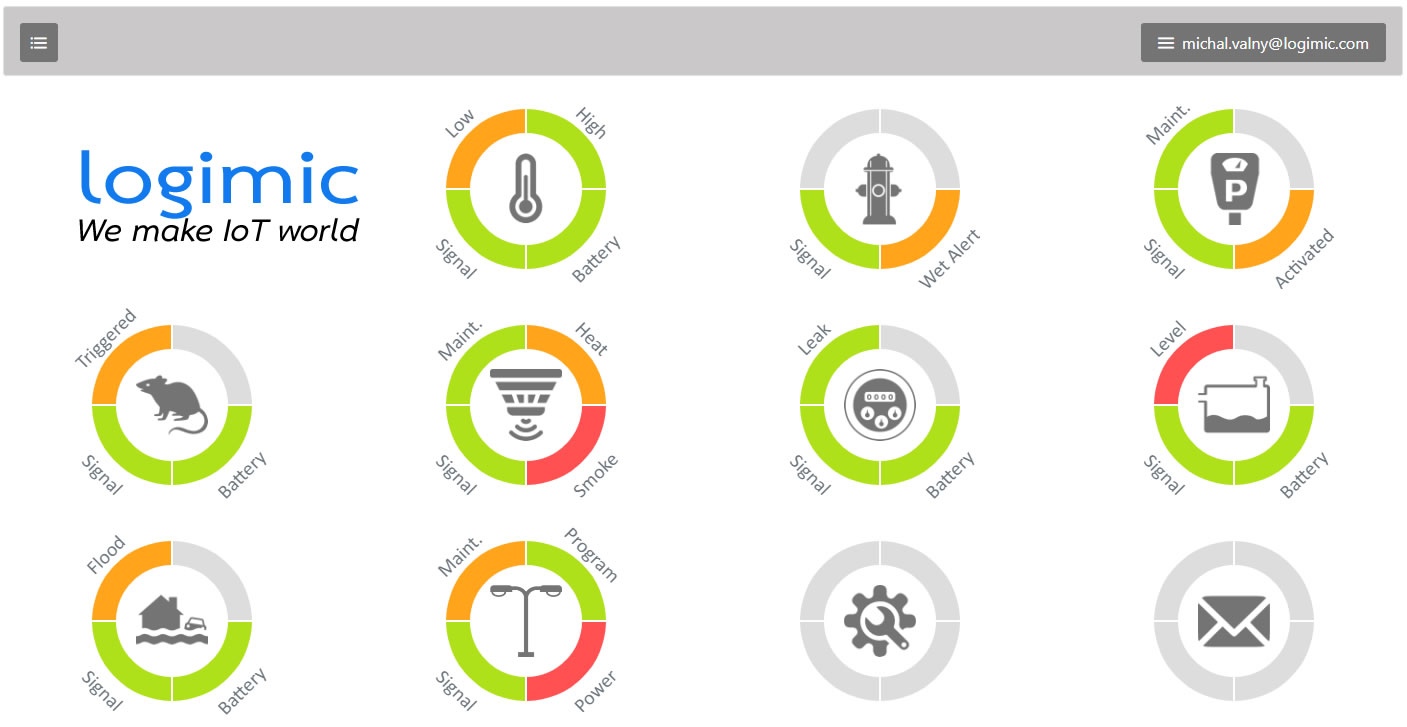
We designed a place where all device data is agregated to showing their states as KPI display.
KPI (Key Performance Index)
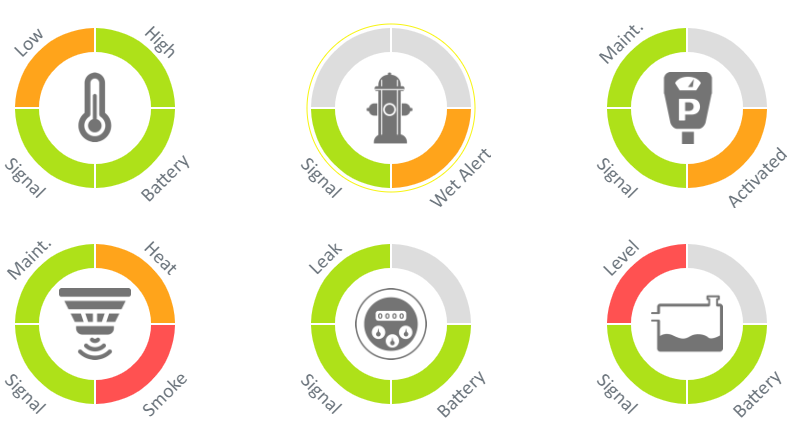
Devices can be gathered into groups by types, locations or other. Each group shows many types of KPI e.g. battgery level, signal quality, temperature level and more.
If any device shows critical KPI the proper color is displayded. By couple of click on the indicator the user goes to the nutshel of issue and displays details of devices.
Front-end solution
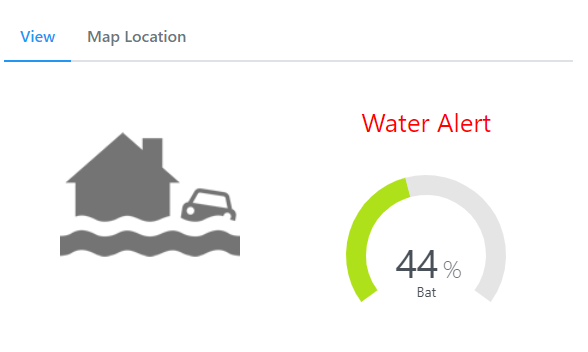
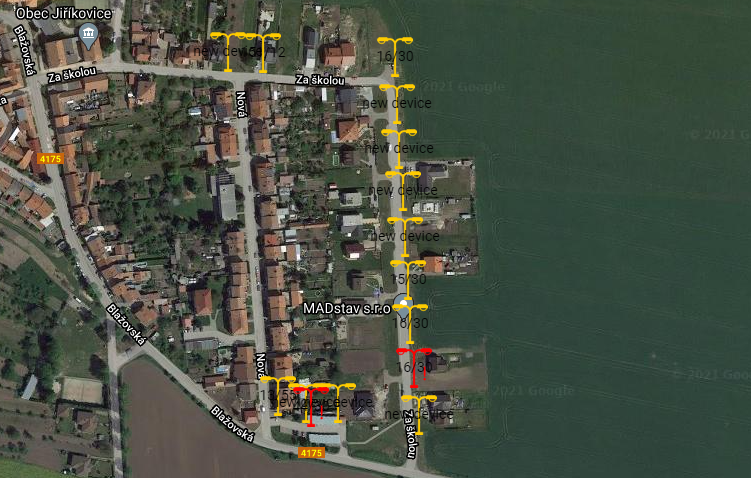
Dashboards are client applications accessible as web applications via your internet browser or mobile application via your mobile devices.
Look and content of dashboard is customized per user requirements. We do not provide uniformed and one style dashboard. We always fully customize our dashboards to fulfill customers feelings and experiences.
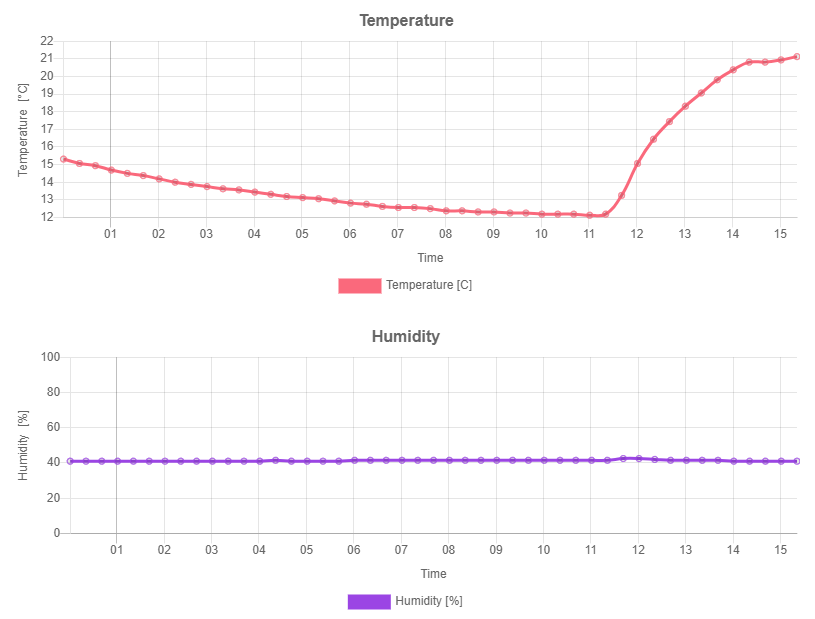
Statistics and trends
We keep full data footprint of each device and sensor. You can see detail activity or measurement via graphs or statistics.
We provide various data analytics modules as searching or errors, discontinuities, trend and more..
We provide various reports over your data as daily, weekly, monthly reports, consumptions reports and more.